Numbers Speak: Crime & Police
CRIME, POLICE AND THE PEOPLE
What the Numbers Tell Us
Humanity has a curious history of obsession with crime. Violence intrigues us, derelictions constantly readjust our sense of morality. But numbers, bunched up into dry statistics, fail to appeal. Yet, every figure tells a story. This paper is an attempt to tap into the statistical figures accessed from official government documents available in the public domain [National Crime Records Bureau (NCRB) and Bureau of Police Research and Development (BPR&D)] on crime, disposal, police infrastructure and police personnel management.
It may be noted at the very outset that these numbers are subject to extensive scrutiny and skepticism, with critics dismissing the figures as unreliable at best, and fudged at worst. However, the importance of numbers coming from government sources can hardly be ignored. These are the only statistics verified through official sources with government bodies held accountable for the veracity of each and every projected figure. It is thus the only comprehensive and verifiable database that can be used for any study aimed at policy recommendation and advocacy.
Crime & Criminality: What’s in it for the Police?
Policing and crime-control appear synonymous on the first glance, but a slightly more nuanced analysis of the two concepts reveals otherwise. Police perception studies worldwide have established a direct correlation of the feeling of safety amongst public with positive perceptions and citizen satisfaction with police services.
It would be untrue to say that high crime figures are necessarily linked with non-performance of the police. This argument is based on two premises: first, that crime in a society occurs due to several sociological and economic churnings in that society, and is not strictly dependent on its criminal justice mechanism. This has been studied and propounded by criminologists over the centuries. Secondly, the increase in crime reporting may actually be a reflection of the proactive functioning of the police in that region (as may be the case in Kerala, discussed below). Conversely, low crime figures might be hiding the real situation which may be due to inaction of police and non-reporting of cases. This is a much-documented problem and one of the chief critiques of the crime figures projected by NCRB. Unfortunately, unlike in developed countries like US, India has not advanced much in victimology studies and therefore there are no official victimisation surveys available to cross-check the crime reporting figures.
A bare look at the state-wise figures, when averaged for the last five years (2011 to 2015), reveals that Kerala has the highest rate of total cognisable crimes. As argued by criminologists such as Ajith Kumar Nair, this could be the result of improving quality of data collection and effective system of registration of cases. While Kerala, Uttar Pradesh and Chhattisgarh are the states with highest cognisable crime rates, Delhi, Assam and Kerala have the highest rates of violent crimes, respectively.
Bihar and Delhi, states notorious for high incidence of crime, exemplify the impact of non-registration of cases on crime rates. Bihar, with a total cognisable crime rate of 173.6 (meaning approximately 174 cases of crimes per lakh of population in the state) and ranking 31st in the list of total cognisable crimes, suddenly jumps up to seventh rank in terms of the rate of violent crimes with a violent crime rate of nearly 40. Similarly, Delhi climbs up from the 14th position in rate of total cognisable crime to the first position in rate of violent crimes. A plausible explanation to this is the poor registration of non-serious cases in the two states, while acknowledging that violent crimes, which include offenses such as murder, robbery, kidnapping and rape, are a lot more difficult to suppress in documentation.
|
States |
Rate of Total Cognizable Crimes (2011-15 average) |
Rate of Violent Crimes (2011-15 average) |
|
Andhra Pradesh |
330.2 |
14.5 |
|
Assam |
280.0 |
45.2 |
|
Bihar |
173.6 |
30.7 |
|
Chhattisgarh |
1255.2 |
24.6 |
|
Gujarat |
647.2 |
13.3 |
|
Haryana |
411.3 |
31.9 |
|
Himachal Pradesh |
244.4 |
18.6 |
|
Jharkhand |
148.8 |
25.4 |
|
Karnataka |
261.7 |
28.0 |
|
Kerala |
1589.3 |
38.7 |
|
Madhya Pradesh |
457.1 |
25.1 |
|
Maharashtra |
316.0 |
26.4 |
|
Nagaland |
72.1 |
11.6 |
|
Odisha |
212.8 |
30.3 |
|
Punjab |
211.6 |
15.7 |
|
Rajasthan |
359.7 |
19.2 |
|
Tamil Nadu |
898.2 |
18.9 |
|
Telangana |
344.0 |
17.7 |
|
Uttar Pradesh |
1098.5 |
18.0 |
|
Uttarakhand |
1319.3 |
18.6 |
|
West Bengal |
202.8 |
26.5 |
| Delhi UT | 576.6 | 63.2 |
| TOTAL (ALL INDIA) | 543.6 | 24.3 |
Data on Rate of Total Cognisable Crimes (IPC and SLL) and Rate of Violent Crimes as an average for the years 2011 to 2015 for 22 major states, arranged alphabetically.
Elaborating on the above argument using an international comparison, if one were to go by a plain reading of the annual crime data released by United Nations Office on Drugs and Crime (UNODC), India has been faring much better than many western countries, including Sweden, Netherlands and Australia - an unlikely proposition. It is only when we look at specific crime figures of homicide that a more realistic picture emerges. India recorded 3.28 murders per lakh of population, a figure much higher than those of the nations mentioned above, with their homicide figures ranging between 0.71 for Sweden to 1.06 for Australia, all for the year 2013.
As in the case of violent crimes, Delhi and Assam figure at the top of the list for rate of total cognisable crimes against women. It is worth noting that most states have seen an increase in the rate of crimes against women, with the exception of a few. This could, in fact, reflect an improvement in registration of cases of crimes against women owing to statutory obligations in law ushered in through the Criminal Law (Amendment) Act, 2013. The rate of increase in these four years is as high as 264 per cent, as in the case of Delhi. Similarly, rate of total cognisable crimes against children has seen a rising trend across all states, presumably attributable to the enactment of Protection of Children from Sexual Offences (POCSO) Act, 2012. Odisha, for instance, displayed an increase of 589 per cent from 2012 to 2015.
Delay in Justice: Who is Responsible?
A more reliable tool to measure performance of the criminal justice system would be through a scrutiny of the disposal rates of cases, both by the police as well as by the courts. In order to arrive at a state-wise comparison of the disposal rates, four variables from the NCRB database were clubbed together to form an index. These are - chargesheeting rate of cases by the police (or the number of cases chargesheeted as a percentage of the total number of cases investigated by the police); disposal percentage of the total number of cases reported to the police; conviction rate of cases in court (or the number of cases convicted as a percentage of the total number of cases tried by the court); and the disposal percentage of the total cases for trial by the courts. Data for the above four variables was taken for a period of five years- 2011 to 2015.
After arriving at the disposal index, a state-wise comparison becomes possible to assess the performance of the different states. The all-India average in the disposal index is 0.72, only three points lower than the highest possible score of 1, signifying a satisfactory state of affairs at the national level. This includes disposal of cases both by the police as well as by the courts, and a higher figure is indicative of improvement in the disposal architecture of the given state. Uttaranchal, Chhattisgarh, and surprisingly, Uttar Pradesh figure at the top of the disposal index, and ten of the 22 states analysed have a score higher than or similar to the national average.
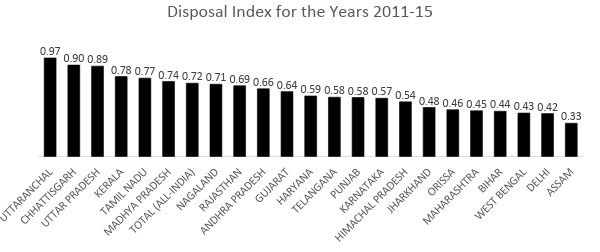
State-wise disposal index calculated for 22 major states in descending order
While the above graph gives a snapshot of the overall disposal mechanism in the states, when broken down into disposal by police and courts, a slightly different picture emerges. Indian legal system is infamous for a profusion of backlog and delays in justice delivery. Preliminary data from a survey conducted by Common Cause and Lokniti suggests that citizens majorly hold the courts, rather than the police, responsible for delays in justice delivery, a finding that is corroborated by the objective data reflecting major gaps in pendency percentage of cases by police and by the courts. This hypothesis stands verified across all states, as shown by the graph below. While the pendency percentage of cases by the police is below 10 per cent in six states, the pendency percentage of cases in courts is uniformly above the 40 per cent mark in all states, and above 90 per cent in six states.

Pendency percentage of Indian Penal Code (IPC) and Special and Local Laws (SLL) cases in police and courts for the years 2011 to 2015 for 22 major states in India
Another problem area for the Indian courts is their low conviction rates, which have fallen over the years even as the crime rates are continually increasing, as recorded by Sen in 2000. While in recent years, conviction rate in India has increased from 72.6 per cent in 2006 to 80 per cent in 2015, it continues to be lower than developed nations such as USA, which had a conviction rate of 93 per cent in 2012. However, the above is a combined conviction rate of cases under both Indian Penal Code (IPC) and Special and Local Laws (SLL). When we look at IPC conviction rates separately, it stands at a poor 46.8 per cent as of 2016. The figures in states such as Bihar, Assam, West Bengal and Odisha are even more alarming, all below the range of 15 percent.
Whether the courts are alone responsible for the low conviction rates is, however, debatable. Investigation of a case is the responsibility of the police, and sub-standard investigation leads to higher acquittal rates. One of the chief demands of advocates for police reforms in India is therefore the separation of investigation and law and order duties of the police, so as to provide operational autonomy to the officers in their task of investigation. This constituted one of the seven directives given by the Supreme Court in the Prakash Singh judgement of 2006.
As for the conviction rates, the devil lies in the details. While the conviction rates overall may be nearly satisfactory, it remains distressing in crimes committed against women, children, Scheduled Castes (SCs) and Scheduled Tribes (STs). The egregious discrepancies in the overall conviction rates and those of cases of crimes against vulnerable sections go on to expose the low priority accorded to these sections by the state. The all-India conviction rate of total cognisable crimes in 2013 standing at 76.6 per cent can be compared with the conviction rate of crimes against children at 30.9 per cent, crimes against SCs at 23.8 per cent and crimes against STs at a meagre 16.4 per cent.
Police for Whom? Diversity in Police Force
The state’s bias towards minorities and depressed sections is not limited just to the poor disposal of cases of crimes against these communities but extends to recruitment and representation of these groups in the police force. While for SCs, STs and Other Backward Classes (OBCs) there are statutory provisions for reservation, most states have incorporated guidelines for 33 per cent reservation for women in the police force. Reservation or positive discrimination is not just a tool to ensure proportionate representation for the upliftment of vulnerable sections, but a basic requirement for a democracy to project itself as an egalitarian and just society. One may even argue that a true test of democracy lies in its ability to include representation from different segments of the society.
However, India is not faring too well in this test, although there have been marginal improvements over the years. Particularly for women, the representation in police force has gone up by almost 2 times since 2007 and stands at 7.1 per cent in 2015. While still way-off the modest benchmark of 33 per cent, an increasing trend provides a hopeful possibility. To be noted are states such as Tamil Nadu (12.99 per cent in 2015), Maharashtra (12.07 per cent) and Himachal Pradesh (12.04 percent), as well as some Union Territories, which project an optimistic picture. A reason that may be attributed to an increase in women in police, other than reservations, could be the legal requirement for women police officers to be handling certain posts and a certain category of cases, such as cases dealing with crimes against women and children, as mandated by amendments in legal provisions recently.
When it comes to the representation SCs and STs in the police, however, all such optimism collapses. As of 2014, only three states in India, including UTs, had achieved the full reservation quota (different for each state) for SCs, and eight states had met the reservation quota for STs. What is worrisome is not just these figures, but the fact that few states are consistently improving upon the recruitment of these groups. In some states, their representation has even fallen over the years. For instance, in Karnataka, while the percentage of reserved seat filled by SCs in 2006 was 105 per cent, it went down to 23 per cent in 2014. Similarly, the representation of STs in Chhattisgarh has gone down by almost half from 2006 and is currently at 20 per cent, as opposed to reservation for 32 per cent.
A popular myth prevalent in north Indian states of UP and Bihar is that of over-representation of OBCs in the police departments of these states. This contention, however, does not hold water when viewed through objective lenses. The percentage of reservation criteria for OBCs met in 2014 in Bihar was 54 per cent, and that in UP was 60 per cent, still much lower than the quotas stipulated for this community. The unfounded fears of reservations “eating up” on general seats quite clearly hold no ground, at least with respect to the police force.
Muslims too are severely under-represented in the police, as is apparent from official data. As of 2013, there were only 6.3 per cent Muslims in the police force in a country with Muslim population of 14.2 per cent (Census 2011). In other words, Muslims are represented in police by less than half the proportion of their actual population. To make matters worse, data on Muslims in police was discontinued after 2013, and data on SCs, STs and OBCs in police was discontinued after 2014. Obfuscation of such pertinent data raises doubts as to the states’ commitment towards improving diversity in police.
Summing-up
It may be noted that favorable data seldom makes for a good story. A critical appraisal of any institution necessarily requires an dispassionate review of its performance, and the good practices that are taken for granted often go amiss in such a commentary. Similar is the case for police and the overall criminal justice system in India. Despite its many shortcomings noted above, the dynamic nature of the police in India has to be recognised with its potential for constant improvement. Previous studies have shown that majority respondents have high levels of trust and satisfaction with the police in India and consider it to be a fair institution. A case in point is the finding that the people who have had direct prior contact with the police have more positive attitudes than those with no direct contact.
This goes to show that the police, in most cases, maintains a nearabout satisfactory level of efficiency and fairness in its dealings with the public, and the situation, when viewed from a bird’s eye perspective, appears to be fast improving. This is a requisite for a healthy democracy. That said, there is of course scope for many a change, particularly at the structural level. There needs to be concerted effort by the states to effectively implement police reforms as directed by the Supreme Court, for starters.
There is no doubt about the fact that police in India suffers from understaffing and deficiency of funds and basic facilities. Police expenditure as a percentage of the state budget at the all-India level stood at 3.01 per cent for the financial year 2015-16, but the problem lies not so much in the poor budgetary allocation to the police as in improper resource distribution and under-utilisation. In 2015, only 57 per cent of the grants for police modernisation were utilised in India. On the other hand, there is also the troubling issue of police excesses and atrocities through different forms of human rights violation by police personnel. Bias against minorities is a real issue in India, as exhibited by the disproportionate representation of minorities in prisons. These, and other seemingly conflicting issues need to be simultaneously addressed for a wholesome analysis of the police structure in India to bring about systemic changes.
*Radhika is a research executive with Common Cause


