Justice as an Essential Service
Repair, Reform, and Build Vital Capacities
Maja Daruwala*
In India, the performance and shortcomings of judiciary, police, prisons and legal aid - four major pillars of the justice delivery system - are often complained about but rarely has their collective capacity to deliver justice been objectively assessed. Recognising this, several organisations including Common Cause, CHRI, DAKSH, TISS-Prayas, Vidhi Centre for Legal Policy, and Centre for Social Justice – all specialists in their own fields came together. To look, if you will, at the bare bones, the muscle and sinew of the system by which justice is delivered and see whether it ‘really has the capacity to deliver’: is its framework strong enough to bear the burden of what is expected of it.
With that, the India Justice Reports 2019 and 2020 (IJR) were born.
The IJR is premised on the belief that justice is an essential service. Essentially, the first of its kind, national periodic report, now in its third edition, ranks through analysis of governments’ own benchmarks and data how well the governments of 18 large and seven small states have equipped their formal justice system to administer justice to a reasonable standard to the millions who regard it as the backbone of our democracy and guarantor of our freedoms.
Through the filters of human resources, infrastructure, workload and diversity the IJR evaluates the capacity of four major pillars of the justice system to deliver its mandate: police, judiciary, prisons and legal aid. Importantly, by comparing data over a five-year period, the IJR can measure efforts governments make year on year to improve the administration of justice. This ‘trend’ analysis helps discern each state’s intention to improve the delivery of justice and match it with needs on the ground. Each report seeks to expand and deepen the data around each pillar and the next report will explore the situation of State Human Rights Commissions.
In order to rank states in a way that would bear scrutiny and be credible, the IJR based its capacity evaluation on only those things that could be objectively measured. It does not venture into institutional culture or attitudes though these can be discerned from data. Illustratively, the low percentage of women across the justice spectrum or the chronic inability to fill caste quotas speaks to institutional biases that perpetuate these exclusions.
In order to gain acceptance at the highest levels of policy the IJR’s assessment is drawn from governments’ own publicly available data set alongside each government’s own proclaimed benchmarks. Juxtaposing the data of all four pillars in one place was intended to create a practical resource and ready reference for policy makers to base holistic decisions on.
At the same time the disaggregation of data across several hundred indicators lends itself to pinpointing what the fault lines and inflection points for repair and reform are, which if addressed, can have a knock on effect on the whole. A common baseline resting on objective facts also creates a place from where media and the active public can begin conversations about repair and reform, compliance and accountability.
Most of all, the IJR was intended to create a periodic index that could track improvements and back sliding and become a benchmark for excellence in justice delivery, as well as be an aspiration for achievement and statecraft that strives to provide better mechanisms for justice delivery year on year to its inhabitants.
The Process
In building the whole, the first order of business was to identify major sources where the data was to be found. Primary sources included NCRB’s Prison Statistics in India, NALSA’s Dashboard, BPR&D’s Data on Police organisations and the National Judicial Data Grid. But beyond these, research had to delve into parliamentary papers, periodic commission reports, state budget documents, CAG reports, annual departmental reports, newsletters and more. Nothing used could be anecdotal. Every indicator cited was referenced to an official source. To the diligent deep-diving researcher there is an enormous amount of information available but mining it is not without its challenges.
Despite this, out of over 100,000 data points the IJR could winnow out 87 comparable indicators across its six broad themes. Raw data was rebased on a common scale so that every indicator could be scored on a scale of one to ten, with one being the lowest or least desirable status, and 10 indicating the highest or best score. This is not necessarily the ideal score or what had been promised in policy or legislation but the best in class so to speak. So, Rajasthan getting 10 on say, prisons is not an indication of having fulfilled its benchmark promises of standard but rather that others have fared worse.
The IJR ascribed equal weightage to every indicator so as to create as even a playing field as possible.
Capacity evaluation requires standards against which reality can be measured. Where possible, the IJR used benchmarks laid down in official documents: in hard law (for example, Madhya Pradesh’s 16 per cent reservation for scheduled castes in the police force); or via policy pronouncements (for example, legal aid has no quota for female panel lawyers, but 30 per cent to 35 per cent reservation for women for the lower judiciary). Where there are no obvious benchmarks, recommendations made in government policy documents were relied on. For example, the Model Prison Manual, 2016 sets an ideal figure of six inmates per jail cadre staff and this was taken as the standard to be met.
Where there was no benchmark at all, the report follows the logic of higher/lower the better. For example, when assessing the number of para-legal volunteers (PLVs) per lakh population since there is no available benchmark, the IJR used the logic of higher the better i.e. states which had more PLVs received a higher score. So, among our large and mid-sized states, Chhattisgarh with 14 PLVs per lakh population received a score of 10, while UP with two received the lowest score of one.
Finally, for fairness it was mete to measure like with like, so the IJR measured 18 states with 10 million or more populations and seven with less in two separate groupings. States that had long been under the Armed Forces Special Powers Act,1958 were not measured because their circumstances are so exceptional that they don’t lend themselves to comparisons. Union territories, because their funding and responsibility is with the Centre, were also excluded from rankings. Though unranked, the IJR provides data for all these entities.
National Findings
At the heart of the report is state ranking. Looked at over two reports, Maharashtra came first both years. And Uttar Pradesh came last both years. Overall, on a scale of one to 10, no state even reached six. In the first year Maharashtra scored 5.92 but in the next iteration it could reach just 5.77. UP, the most populous state in the country could not touch four. Smaller states did not reach even five though they have smaller populations to govern and deliver justice to. Interestingly, between first and last even small changes in one sub-system like improving diversity in police, filling judge vacancies, or improving prison budgets worked to significantly improve state rankings. Uttar Pradesh, for instance, which had 53 per cent vacancies in the constabulary and 63 per cent among officers in 2017 jumped three spots in the police ranking to fifteenth, owing largely to recruitment drives that have reduced vacancies in 2020. This has had a positive impact on the share of officers in the police and improved the number of women personnel.
At an all-India level, the IJR confirmed all the common impressions public discourse frequently comments on and highlights. But indisputable figures provide them a weight and will ground an objective base for future discussion amongst policy makers and informed participation by citizens as users of the justice system.
All sub-systems are plagued by shortage of money and shortage of staff. When budgets are increased the police get the lions share and none of sub-systemic budgets increase in proportion to increase in GDP. Legal aid provides a good example of disproportionately low allocations. Despite 80% of the population being eligible, yet, till 2019, India’s per capita free legal aid spend was ?1.05 in 2019-2020, rising to ?1.27 per capita with the allocation of 170 crores to NALSA in 2022-2023. Over five years, this has been the highest. By contrast, in 2017, Argentina spent $174 per capita on legal aid.
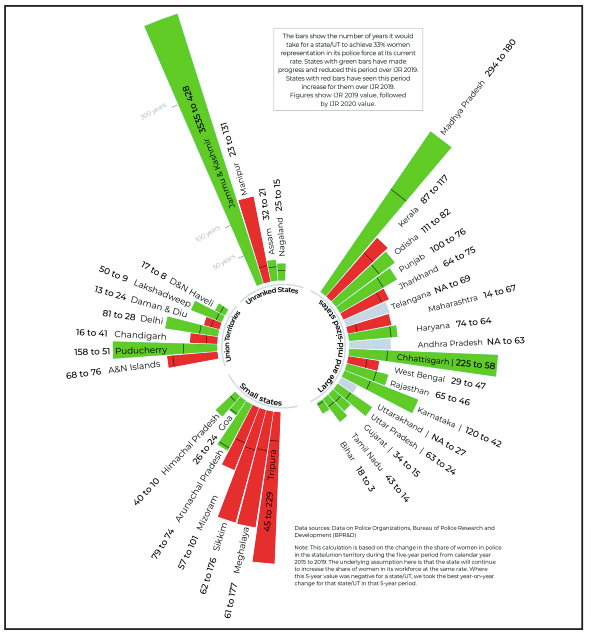
Equity and equality – something the justice system which is in the business of delivering justice to others should demonstrate within itself - - remains distant. Data availability of caste is confined to the lower echelons and not recorded at the higher levels of any sub-system. Women, wherever they are to be found are at the lower levels in each subsystem, rarely reaching the much spoken of 33%. In some states subordinate court women judges will reach 70% (Goa, as of August 2022) but further up the pecking order everywhere the proportion of women falls sharply into single figures. The glass ceiling remains intact.
The share of women in the police force is 10.5%. The aspiration is to take it to 33%. At present rates of increase, it will take 33 years to reach 33% women nationally. Among large and mid-sized states, Odisha will take 428 years to reach 33%, while Bihar only eight years.
The IJR details human resource deficits statewise and pillar wise.
Across the board, staff shortages run at between 20 to 30%. Nationally about one in three police officers and one in five constable posts lie vacant with Bihar having the highest vacancy at 41% (constables) & 51% (officers) according to Data on Police Organisations 2021.
Medical officer shortfall is rife but can go up to 48.2% as in Uttarakhand, where the vacancy for medical officers clocks in at 90%. As per PSI 2021, there are 658 medical officers for 554,034 inmates which works out to one medical officer for 842 inmates. While medical officers’ strength has reduced from 797 (December 2020) to 658 (December 2021), inmate population increased from 488,511 to 554,034.
Judge vacancies are another chronic area of concern. In 1987 the Law Commission’s 120th report on manpower planning recommended 50 judges for every 10 lakh people. In 2020, the sanctioned strength works out to 21.03 judges per 10 lakh people, an improvement from 20.39 judges per 10 lakh people in 2019. 27 states/UTs had one subordinate court judge for over 50,000 people. Although judge vacancies have come down on average, one in three judges in the high court was missing and one in four among subordinate judges. In 16 out of 18 large and mid-sized states, HC judges vacancies run at over 25%.
All this is compounded by shortfalls in infrastructure: per example, equipment and vehicles at police stations and courthalls for judges. Presently, the courthalls shortage stands at around 13%. Meanwhile, cases continue to mount and despite some brisk disposals the workload is unreal. As of December 2020, Nationally, prison overcrowding averaged at 130%. Looked at more closely overcrowding in individual jails tell a more desperate story: for instance, Mumbai Central jail’s occupancy touches over 446% in September 2022. Undertrials make up 77% of this population and has risen consistently year on year, even as many more than before have to wait longer in prisons for investigations and trials to conclude. And so it goes.
But there is good news too. Despite challenges of money and manpower, there are scattered improvements to be seen in different states and different areas. Scattered because they appear to be stand alone and don’t signal a pattern of addressing the problem of administration of justice holistically. The share of women has improved in almost all states, and all ranked states1 have reduced average five-year vacancies in at least one post, except Kerala and Meghalaya. Compared to IJR 2019, all states have contributed more towards legal services expenditure as of 2019-202 which suggests a mounting recognition of the value of this service.
From the original periodic flagship report, the IJR Collective has now spun off a series of satellite resources all geared to improving justice delivery. These include: state fact-sheets in over nine languages, analysis of budgets available for justice delivery, and thematic analyses of police and prisons capacity improvements and deficits, based on data from Crimes in India and Prison Statistics in India as soon as these are published.
Nevertheless, statistical measurements of structure are neither endorsements of better performance on the ground, nor translate into improved response nor public satisfaction. But they do point to essential areas that require attention repair and reform. Data can at best tell half a story and sometimes a misleading one. For example, a state that has just one sanctioned staff for a post say, a prison psychologist, can score a hundred percent improvement by increasing that to two and mask the fact that two psychologists for several thousand prisoners in the state remains wholly inadequate.
Mathematical measures cannot take account of the textures of performance, nor of empathy, culture, attitudes, bias, or public perception. In short, at best they present the more obvious long bones of the skeleton but not the flesh, the blood, the nerves, or even the tiny synapses that make up the whole. Yet, in bringing together scattered data, the IJR presents an analysis of some essential preconditions for ensuring that duty holders have the resources to perform the tasks required in each sub-system and points to some essential areas that require urgent intervention.
Collation and statistical assessment has been no easy task. Official data continues to be collected at different times and in varied formats, transmitted to collection centres without rigorous verification, is subject to sudden category changes and disappearance of detail. It is also often recorded in non-machinereadable forms, its granularity sequestered from the public behind password protected walls or siloed within departments, and selectively shared with the public. Incomplete, delayed, or contradictory data that does not align with fiscal, recruitment and planning cycles negatively impacts its ability to be of optimum use for last mile-oriented policy planning.
Looking Ahead
The role the justice system has to play in the coming time will be of even greater significance, in view of the Covid 19 pandemic era. Widening income disparities, competition for scarce resources, broken social cohesion, contended space for civic participation, the asymmetries of power between individuals, communities and the state and individual desperation, will all create ever more demand for adjudication, compensation, restitution, and fair civil and criminal process than ever before.
In building back better, not only must the justice system-model itself to be people-centric but also ensure that basic human rights and justice for all are upheld. It must design itself as an enabler: to restore social cohesion, political and public morality, and economic equity in the context of this enormous disruption. Keeping equality, empathy and humanitarianism at its core, it must act now to anticipate the consequences of the virus and adapt itself to the needs of individuals, communities, and businesses.
Endnotes
- Excluding Andhra Pradesh and Telangana
- 2017-18 figures have been repeated for Kerala, Chandigarh (not ranked), Andaman & Nicobar Islands (not ranked), Lakshadweep (not ranked)
NEXT »


